Flowchart: How Startups Can Crush Their KPIs Every Time
Monitoring your app analytics and user data is important for any app looking to achieve its goals – whether they be to improve retention, acquisition, engagement, or any other measure of success.
Lately I’ve been reading the fantastic book Lean Analytics by Alistair Croll and Benjamin Yoskovitz.
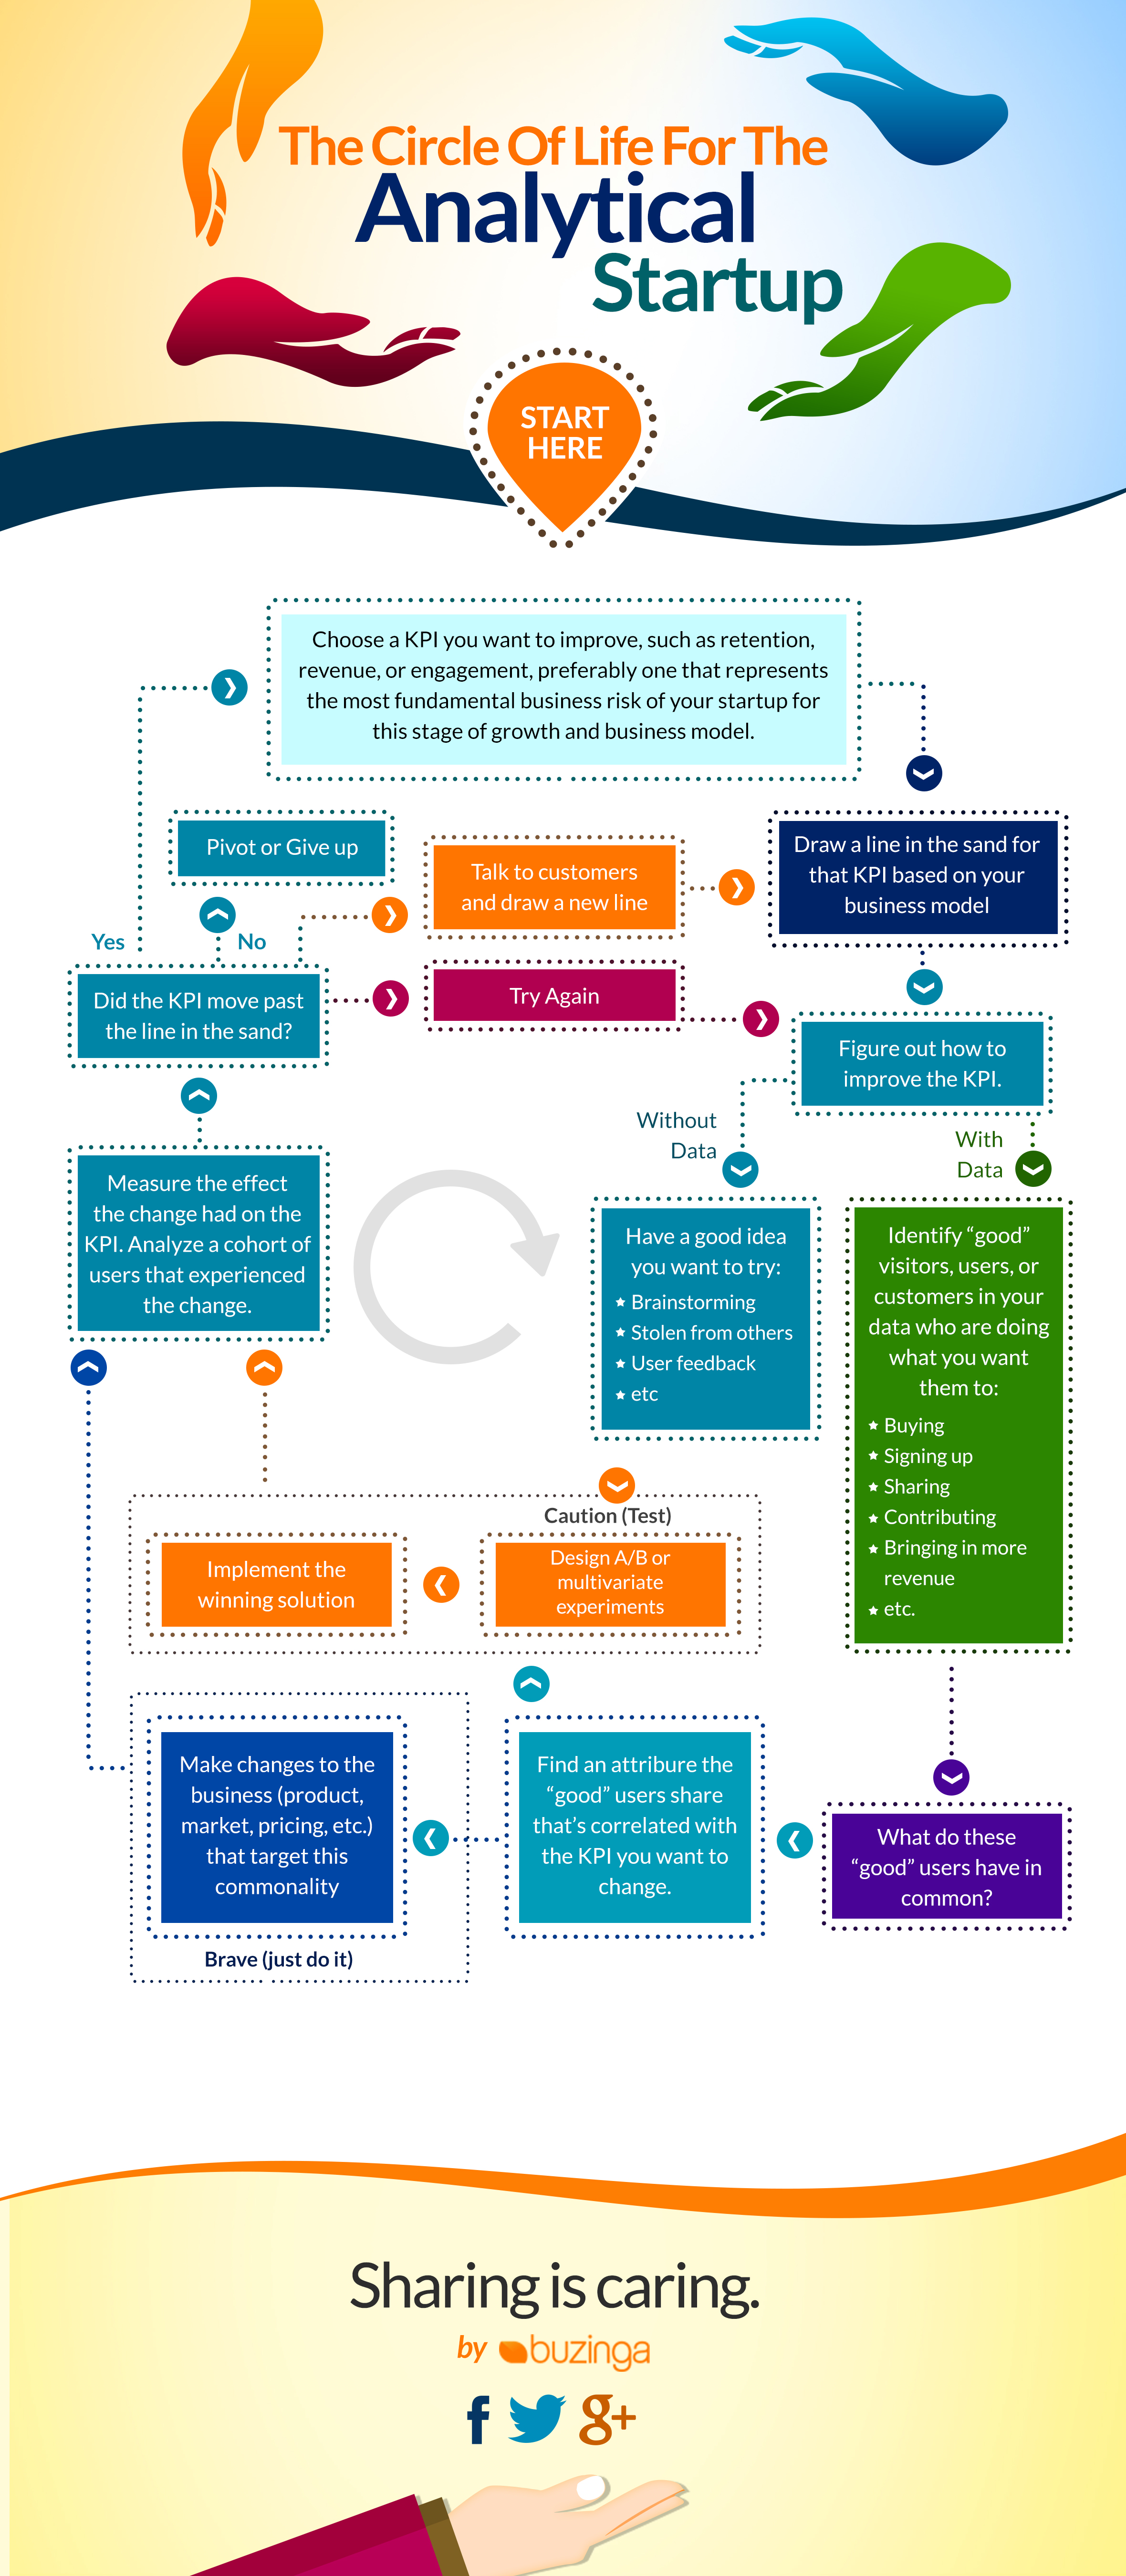
In it, Croll and Yoskovitz propose this thought-provoking analytical startup circle below – and by ‘analytical startups’, I’m referring to any startup that wants to see constant growth in its Key Performance Indicators! (KPIs).
Read on after the image for how to execute the steps!
1. Begin by choosing the most important KPI you want to improve
Obviously, every app wants to get more downloads, increase average revenue per user, etc, but stick to the one KPI that will make the most difference to your business at that time.
2. Figure out how to improve that KPI
This is the hard part.
Without data, an app is pretty limited in resources to guide decisions.
Make sure your check out this comparison of the Most Popular Mobile App Analytics Tools if you’re struggling to decide which service to go with!
Without data, you’re basically just running on assumptions. However, there are a few free ways to ensure these assumptions are as realistic and educated as possible.
Ensure the ideas you’re brainstorming are informed by competitor analysis, real user feedback, and online research using tools like SEMrush, Sensor Tower, Google AdWords and App Annie intelligence data, to name a few!
With data, you’ve got some great stats on user behaviour to drive insights.
Analyse your user pathways to see where users are dropping off or experiencing bottle necks. What’s stopping them from completing the actions you want them to?
Sort your best (ideal) users into their own category and analyse them to find out what they all have in common.
What is driving them to complete your desired action?
How can you target that driver to get more users to exhibit similar behaviours?
3. Implement it, or test it
Once you’ve identified the commonality, you have two options:
- Bite the bullet and make the necessary change
This change may not be a change to your app itself – make sure you check out The Product Death Cycle to find out why adding features is rarely the answer to slow app growth.
You may need to change your startup’s positioning, target new segments, alter the pricing or incentives…There are many possible ways to address the KPI, and sometimes just doing it hard and fast is the best way to go.
- Test it first
If you’re a bit more cautious, design an A/B or multivariate experiment(s) to assess changes in user behaviour before you implement the change to your entire user base.
This can be a good tactic if the change you’re implementing is quite a dramatic one.
Rather than risking alienating all your app users, you can slowly roll out the changes and make adjustments along the way.
This will ensure that the change is optimised to appeal to the broadest set of users.
4. Measure
There is no point executing campaigns if you aren’t going to set formal metrics for how you will measure their effectiveness.
After a previously set amount of time has passed (at least 1 month), go back to your data and analyse a certain set of users.
What happened to their behaviour as a result of the change you implemented?
5. Start all over again
This isn’t called a circle for nothing!
If the change you implemented moved the KPI up to the desired goal, congrats!
Move on to the next KPI you want to change!
If the change didn’t make a dent in your KPI, it’s time to reassess, pivot or talk to your users again.
Following this flowchart will keep your app in a constant state of never ending improvement! Let me know your thoughts on the ‘circle of life’ for analytical startups below!
Latest posts by Logan Merrick (see all)
- Ep 18: Collective Campus’ CEO on Intrapreneurship and Corporate Innovation - December 20, 2016
- 50 User Engagement Strategies For Planning Memorable Mobile Experiences - December 19, 2016
- Latest Data: App Monetisation Trends And Drivers 2015-2020 - November 25, 2016


